In this tutorial, we’ll build KNN with NumPy from scratch to understand how the K-Nearest Neighbors algorithm works.
We’ll apply it to a real-world diabetes dataset that is available on Kaggle to predict whether a patient is likely to have diabetes based on health factors like glucose level, BMI, and age.
KNN is one of the simplest and most intuitive machine learning algorithms. Instead of learning explicit patterns, it makes predictions by comparing new data points to existing ones. This makes it a great first project for anyone learning how algorithms work behind the scenes.
In this guide, you’ll learn how to:
- Implement the KNN algorithm manually using
NumPy. - Understand how distance metrics affect classification.
- Prepare and standardize a healthcare dataset.
- Evaluate model performance with accuracy and a confusion matrix.
We’ll go step by step, explaining both the math and the code in simple terms, so you not only write the code but also understand why it works.
1. Importing Libraries
Before we begin building the KNN model, we first import the core Python libraries that will power our analysis. Each plays a small but important role in our workflow.
We use NumPy for numerical operations like distance calculations, Pandas for handling the dataset, and Matplotlib plus Seaborn for visualizations. These libraries form the foundation of most data science projects.
We also include Python’s built-in Counter class from the collections module to help count votes when predicting classes in our KNN model.
Here’s the code we start with:
# Import essential libraries
import math
import warnings
from collections import Counter

import numpy as np
import matplotlib.pyplot as plt
import pandas as pd
import seaborn as sns
from scipy.stats import levene, ttest_ind
from sklearn.model_selection import train_test_split
from sklearn.metrics import accuracy_score, classification_report, confusion_matrix2. Importing and Previewing the Dataset
With our tools ready, the next step is to bring in the dataset we’ll use to train and test our model.
For this project, we’re using a diabetes dataset that contains several medical measurements for female patients, such as glucose level, blood pressure, skin thickness, insulin level, body mass index (BMI), and age. The goal is to predict whether a patient has diabetes based on these health indicators.
We begin by loading the data using Pandas and taking a quick look at the first few rows:
# Load dataset
data = pd.read_csv("Healthcare-Diabetes.csv")

# Preview a few rows
data.head()
- Each row represents one patient’s medical record, and the
Outcomecolumn indicates whether the person has diabetes,1means diabetic,0means non-diabetic.
To understand the dataset structure, we check its basic info:
# Dataset information
data.info()RangeIndex: 2768 entries, 0 to 2767
Data columns (total 10 columns):
# Column Non-Null Count Dtype
--- ------ -------------- -----
0 Id 2768 non-null int64
1 Pregnancies 2768 non-null int64
2 Glucose 2768 non-null int64
3 BloodPressure 2768 non-null int64
4 SkinThickness 2768 non-null int64
5 Insulin 2768 non-null int64
6 BMI 2768 non-null float64
7 DiabetesPedigreeFunction 2768 non-null float64
8 Age 2768 non-null int64
9 Outcome 2768 non-null int64
dtypes: float64(2), int64(8)
- This tells us the dataset has 2,768 records and 10 columns, all containing numeric values. That’s a good sign because algorithms like KNN work best with numerical data.
At this stage, we’ve confirmed that the dataset is loaded correctly and ready for exploration.
Next, we’ll perform Data Cleaning. Although our data looks clean, you will be surprised if you look closer.
3. Data Cleaning
Before jumping into analysis or model building, it’s crucial to make sure our data is clean and reliable. Machine learning models are only as good as the data we feed them. Even simple errors or missing values can lead to misleading results.
We begin by checking for duplicate records in the dataset:
print(f'Duplicated rows: {data.duplicated().sum()}')Duplicated rows: 0
Next, we identify columns that contain biologically implausible zeros. In medical data, a glucose level, blood pressure, or BMI value of zero doesn’t make sense, it likely represents missing information that was recorded as 0 in the dataset.
We treat these zeros as missing values and replace them with NaN (Not a Number):
# Identify columns where zeros are biologically implausible (treated as missing)
cols_with_zero = ['Glucose', 'BloodPressure', 'SkinThickness', 'Insulin', 'BMI']
data[cols_with_zero] = data[cols_with_zero].replace(0, np.nan)
print(f'Missing Values: {data.isnull().sum().sum()}')Missing Values: 2312
- That’s quite a lot, but it’s expected since medical datasets often contain incomplete records.
- To handle these missing values, we fill them with the median value of each column. The median works well here because it’s less affected by outliers than the mean.
# Fill missing values
data = data.fillna(data.median())Finally, we remove the Id column since it’s only an identifier and doesn’t provide useful information for prediction.
# Delete identifier column
data = data.drop(columns=['Id'])After these cleaning steps, our dataset is ready for analysis.
We’ve ensured all values are biologically valid, replaced missing data responsibly, and kept only the features that matter for predicting diabetes.
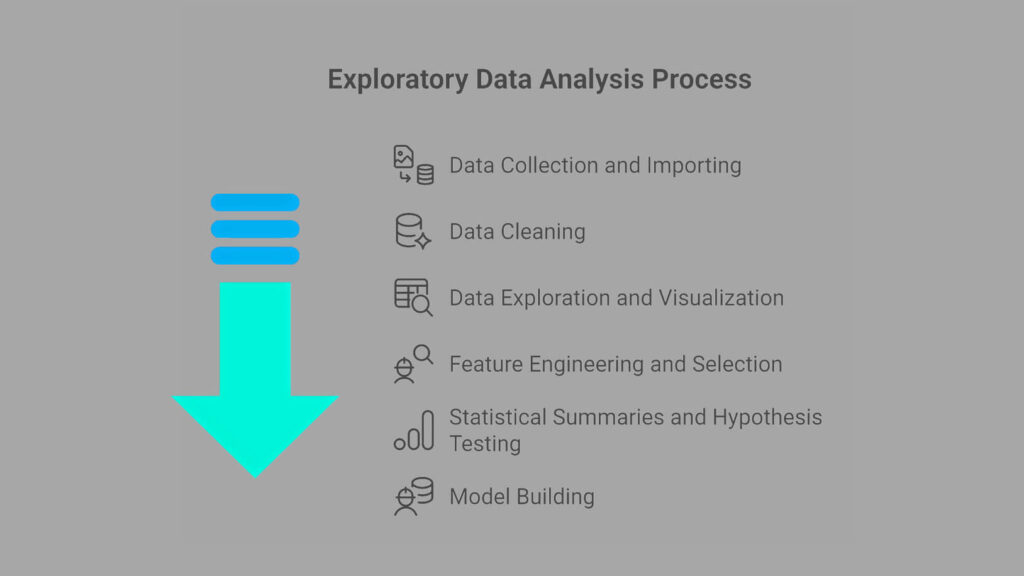
4. Exploratory Data Analysis (EDA)
With a clean dataset in place, we can now explore it to understand how the data behaves. EDA helps us uncover patterns, detect outliers, and gain insights into relationships between variables.
3.1 Distribution of the Target (Outcome)
We start by examining the target variable, Outcome. This column tells us whether a patient is diabetic (1) or non-diabetic (0). Understanding its distribution helps us check for class balance, which can affect how well our model learns.
Here’s the code that generates the distribution plot:
sns.countplot(data=data, x='Outcome', palette='Set2')
plt.title('Distribution of Diabetes Outcome', fontsize=13)
plt.xlabel('Outcome (0 = Non-Diabetic, 1 = Diabetic)')
plt.ylabel('Count')
plt.show()
- The plot shows that the number of non-diabetic patients is noticeably higher than those who are diabetic.
To confirm this, we calculate the exact counts and percentages:
# Display class balance in percentage
data['Outcome'].value_counts().to_frame(name='Count').assign(
Percent=lambda x: round((x['Count'] / x['Count'].sum()) * 100, 2))Count Percent
Outcome
0 1816 65.61
1 952 34.39
- About 65.6% of the patients are non-diabetic, while 34.4% are diabetic.
- This indicates a moderate class imbalance, which is quite common in medical datasets.
- It means our model will see more examples of non-diabetic patients than diabetic ones. When we later evaluate performance, we’ll keep this imbalance in mind to ensure our model doesn’t become biased toward the majority class.
With a clear view of our target variable, we’re ready to explore how the other health features, such as glucose, BMI, and age, differ between these two groups.
3.2 Univariate Variable Analysis
After reviewing the target variable, the next step is to look at each feature individually. This process, called univariate analysis, helps us understand the range, spread, and shape of our data. By exploring one variable at a time, we can detect outliers and skewed distributions, both of which are important when using algorithms like KNN that rely on distance measurements.
We start by checking the statistical summary of each feature:
# Statistical information
data[cols].describe().T
This output gives us the mean, standard deviation, and percentiles for every medical measurement in our dataset.
A few observations stand out:
Glucoselevels range from 44 to 199, with an average around 122. This shows a wide variation in blood sugar levels among patients.BMIhas a mean of roughly 32.6, suggesting that most patients are in the overweight category, a known risk factor for diabetes.Insulinvalues have a very large standard deviation, which indicates that the data contains some extreme values.Agehas an average of 33, suggesting that the dataset mostly represents younger adults.
Next, we visualize the data using histograms and boxplots to get a clearer picture of their distributions:
# Plot the distribution
for col in cols:
    plt.figure(figsize=(12, 4))

    # Histogram
    plt.subplot(1, 2, 1)
    sns.histplot(data=data, x=col, kde=True)

    # Boxplot
    plt.subplot(1, 2, 2)
    sns.boxplot(data=data, y=col, color='lightgreen')


- The histograms show how each feature is spread, while the boxplots highlight the presence of outliers.
To confirm this visually, we also calculate the number of outliers and the skewness (a measure of how asymmetrical a distribution is):
for col in cols:
    q1 = data[col].quantile(0.25)
    q3 = data[col].quantile(0.75)
    iqr = q3 - q1
    lower = q1 - iqr * 1.5
    upper = q3 + iqr * 1.5
    outliers = data[(data[col] < lower) | (data[col] > upper)][col]
    print(f'=== {col} ===')
    print(f'Outliers: {len(outliers)}')
print(f'Skew: {data[col].skew()}')=== Pregnancies === Outliers: 16 Skew: 0.9590963213692726 === Glucose === Outliers: 0 Skew: 0.5211305020647523 === BloodPressure === Outliers: 49 Skew: 0.1974036294152549
=== SkinThickness ===
Outliers: 316
Skew: 1.191207865894857

=== Insulin ===
Outliers: 1126
Skew: 3.1015773566846057

=== BMI ===
Outliers: 38
Skew: 0.8534493332926469
=== DiabetesPedigreeFunction ===
Outliers: 97
Skew: 1.8427906939007215

=== Age ===
Outliers: 64
Skew: 1.1662989470696625
Here’s what we find:
Pregnancies:Slightly right-skewed (~0.96) with a few high outliers, meaning most patients have few pregnancies while a few have many.Glucose:Almost symmetric (skew ~0.52) and free of outliers, making it one of the most stable features.BloodPressure:Mild right skew (0.19) with 49 outliers, showing occasional extreme readings.SkinThickness:Noticeable right skew (1.19) and 316 outliers, suggesting variability in body fat levels.Insulin:Highly skewed (3.10) with more than a thousand outliers, confirming that insulin values vary widely across patients.BMI:Moderate skew (0.85) with a few outliers, still fairly usable for modeling.DiabetesPedigreeFunction:Strong right skew (1.84), meaning most people have low genetic risk but a few have high risk.Age:Positive skew (1.17), showing more young patients than older ones.
In summary, the dataset has several features with non-normal distributions and many outliers, especially in Insulin and SkinThickness.
Since KNN depends on measuring distances between points, differences in scale or extreme values can distort the results.
We’ll address this later by scaling the features to ensure fair distance comparisons.
3.3 Feature Relationship with Target (Outcome)
After understanding how each variable behaves on its own, we now explore how these features relate to the target variable Outcome.
This helps reveal which medical indicators, such as glucose level, BMI, or age, show clear differences between diabetic and non-diabetic patients. Recognizing these relationships not only deepens our understanding of the dataset but also guides us in identifying the most predictive features for the KNN model.
We start by plotting the average value of each feature for the two outcome classes:
# Plot mean feature Comparison with the target (Outcome)
n_cols = 3
n_rows = math.ceil(len(cols) / n_cols)

plt.figure(figsize=(6 * n_cols, 5 * n_rows))
for i, col in enumerate(cols, 1):
    plt.subplot(n_rows, n_cols, i)
    sns.barplot(data=data, y=col, x='Outcome', ci=False, palette='Set2', estimator='mean')
    plt.title(f'{col} vs Outcome', fontsize=17)
    plt.xlabel('Outcome (0 = Non-Diabetic, 1 = Diabetic)', fontsize=15)
    plt.ylabel(f'Average {col}', fontsize=15)

plt.tight_layout()
plt.subplots_adjust(hspace=0.4)
plt.show()
The resulting grid of bar plots shows the average value of each medical feature grouped by outcome.
Several trends are immediately clear:
Glucose,BMI, andAgeare noticeably higher among diabetic patients.InsulinandSkinThicknessalso show slight increases in the diabetic group.- These differences align with real-world medical knowledge, reinforcing the validity of the dataset.
To confirm what we see visually, we calculate the mean values of each feature for both diabetic and non-diabetic patients:
# Mean feature comparison by target (Outcome)
for col in cols:
    average = data.groupby('Outcome')[col].mean().to_frame(name='Mean')
    print(f'=== {col} ===')
    print(round(average, 2))
=== Pregnancies ===
         Mean
Outcome
0        3.20
1        4.77

=== Glucose ===
           Mean
Outcome
0        111.06
1        142.46

=== BloodPressure ===
          Mean
Outcome
0        70.89
1        75.23
=== SkinThickness ===
          Mean
Outcome
0        27.85
1        31.79

=== Insulin ===
           Mean
Outcome
0        128.70
1        163.49

=== BMI ===
          Mean
Outcome
0        31.10
1        35.44
=== DiabetesPedigreeFunction ===
         Mean
Outcome
0        0.43
1        0.54

=== Age ===
          Mean
Outcome
0        31.11
1        36.99
We can see clear distinctions between the two groups:
GlucoseandBMIshow the most significant differences, with higher averages among diabetic patients.Insulin,SkinThickness, andAgealso trend upward for diabetics, suggesting they may contribute to higher diabetes risk.Pregnanciesare slightly higher among diabetic individuals, which aligns with known medical patterns in gestational and type 2 diabetes.
These insights highlight Glucose, BMI, and Age as key features that our KNN algorithm will likely rely on for prediction.
To ensure these differences are not due to random variation, we perform a two-sample t-test. This test checks whether the average of each feature differs significantly between diabetic and non-diabetic groups.
# T-test
alpha = 0.05
for col in cols:
    diabetes = data[data['Outcome'] == 1][col]
    no_diabetes = data[data['Outcome'] == 0][col]
    _, lev_p = levene(diabetes, no_diabetes, center='median')
    equal_var = lev_p >= alpha
    t_stat, p_value = ttest_ind(diabetes, no_diabetes, equal_var=equal_var)
    print(f'=== {col} ===')
    print(f't-stat: {t_stat:.4f}, p-value: {p_value:.4f}')
    print(f'Test: {"Standard" if equal_var else "Welch"}')
    print(f'Null Hypothesis (Ho): Average {col} are similar whether with diabetes or not.')
    decision = "Reject null hypothesis they are the same." if p_value < alpha else "Fail to reject null hypothesis they are the same"
print(f'Decision: {decision}')=== Pregnancies ===
t-stat: 11.2158, p-value: 0.0000
Test: Welch
Null Hypothesis (Ho): Average Pregnancies are similar whether with diabetes or not.
Decision: Reject null hypothesis they are the same.
=== Glucose ===
t-stat: 28.1009, p-value: 0.0000
Test: Welch
Null Hypothesis (Ho): Average Glucose are similar whether with diabetes or not.
Decision: Reject null hypothesis they are the same.
=== BloodPressure ===
t-stat: 9.1720, p-value: 0.0000
Test: Standard
Null Hypothesis (Ho): Average BloodPressure are similar whether with diabetes or not.
Decision: Reject null hypothesis they are the same.
=== SkinThickness ===
t-stat: 11.2422, p-value: 0.0000
Test: Welch
Null Hypothesis (Ho): Average SkinThickness are similar whether with diabetes or not.
Decision: Reject null hypothesis they are the same.
=== Insulin ===
t-stat: 9.9030, p-value: 0.0000
Test: Welch
Null Hypothesis (Ho): Average Insulin are similar whether with diabetes or not.
Decision: Reject null hypothesis they are the same.
=== BMI ===
t-stat: 16.0391, p-value: 0.0000
Test: Welch
Null Hypothesis (Ho): Average BMI are similar whether with diabetes or not.
Decision: Reject null hypothesis they are the same.
=== DiabetesPedigreeFunction ===
t-stat: 8.0153, p-value: 0.0000
Test: Welch
Null Hypothesis (Ho): Average DiabetesPedigreeFunction are similar whether with diabetes or not.
Decision: Reject null hypothesis they are the same.
=== Age ===
t-stat: 13.1090, p-value: 0.0000
Test: Welch
Null Hypothesis (Ho): Average Age are similar whether with diabetes or not.
Decision: Reject null hypothesis they are the same.
- Every feature produces a p-value less than 0.05, meaning the differences in means between the two groups are statistically significant.
- In simple terms, there’s strong evidence that features like
Glucose,BMI,Insulin, andAgevary meaningfully between diabetic and non-diabetic patients. - This confirms that these features will provide useful signals for the upcoming KNN classification.
With these findings, we now understand which health metrics matter most in distinguishing diabetes outcomes. The next step is to build our KNN with NumPy from scratch and put these insights into action.
4. Implementing K-Nearest Neighbors (KNN) with NumPy
Now that we’ve explored the dataset and understood the relationships between variables, it’s time to build our own K-Nearest Neighbors (KNN) model from scratch.
Most people use pre-built libraries like scikit-learn, but in this project, we’ll implement the algorithm manually using only NumPy.
This approach helps you truly understand how KNN works behind the scenes — how it measures similarity, finds nearest points, and makes predictions by simple voting.
Understanding KNN in Simple Terms
KNN is a distance-based algorithm. When it encounters a new data point, it looks for the k closest data points in the training set.
It then predicts the new point’s class by majority vote, whichever class is most common among those neighbors.
Think of it as asking your closest friends for advice; the majority opinion usually determines your choice. That’s exactly what KNN does mathematically.
Step 1: Building the KNN Classifier from Scratch
We begin by defining a helper function to calculate the Euclidean distance between two points. This measures how far apart two samples are in feature space, the smaller the distance, the more similar they are.
def euclidean_distance(x1, x2):
    """
    Calculate the Euclidean distance between two points.
    :param x1: (1D numeric array) First point
    :param x2: (1D numeric array) Second point
    :return: (Float) Euclidean distance between x1 and x2.
    """
return np.sqrt(np.sum((x1 - x2) ** 2))Next, we create a KNN class that encapsulates the core logic: storing data, computing distances, and predicting labels through majority voting.
class KNN:
    def __init__(self, k=3):
        """
        Initializes the KNN model.
        :param k: (int) Number of nearest neighbors to consider.
        """
        self.k = k
        self.X_train = None
        self.y_train = None

    def fit(self, X_train, y_train):
        """
        Store the training data.
        :param X_train: Training feature matrix.
        :param y_train: Training labels.
        :return: None
        """
        self.X_train = np.array(X_train, dtype=float)
        self.y_train = np.array(y_train)

    def _predict_single(self, x):
        """
        Predict the label for a single sample using majority vote.
        :param x: Single sample to classify.
        :return: Predicted label for the input sample.
        """
        x = np.array(x, dtype=float)

        # 1. Compute distances between x and all training samples
        distances = [euclidean_distance(x, x_train) for x_train in self.X_train]

        # 2. Identify the indices of k nearest neighbors
        k_indices = np.argsort(distances)[:self.k]

        # 3. Retrieve their labels and perform majority voting
        k_neighbour_labels = [self.y_train[i] for i in k_indices]
        most_common = Counter(k_neighbour_labels).most_common(1)

        return most_common[0][0]

    def predict(self, X_test):
        """
        Predict labels for all samples in X_test.
        :param X_test: Test feature matrix.
        :return: Predicted labels for the test set.
        """
        X_test = np.array(X_test, dtype=float)
        predictions = [self._predict_single(x) for x in X_test]
return np.array(predictions)- This custom class mimics what libraries like
scikit-learndo under the hood. - It’s simple but powerful: store the data, compute distances, and let the majority of nearest neighbors decide the class.
Step 2: Applying the KNN Model
Next, we’ll use our custom-built KNN model on the diabetes dataset. We’ll split the data into training and test sets, scale the features for fairness, and then make predictions.
# Separate features and target
X = data.drop(columns=['Outcome'])
y = data['Outcome']

# Split train and test data
X_train, X_test, y_train, y_test = train_test_split(X, y, test_size=0.3, random_state=42)

# Standardize features
X_train_scaled = (X_train - X_train.mean(axis=0)) / X_train.std(axis=0)
X_test_scaled = (X_test - X_train.mean(axis=0)) / X_train.std(axis=0)

# Initialize and fit KNN model
knn = KNN(k=5)
knn.fit(X_train_scaled.values, y_train.values)

# Predict on test data
y_pred = knn.predict(X_test_scaled)
y_pred[:10]array([0, 0, 1, 0, 1, 0, 0, 0, 1, 1])
- Each prediction corresponds to whether a patient is non-diabetic (
0) or diabetic (1). - Even though we built this model manually, it can now make real predictions just like a library-based classifier.
Step 3: Evaluating Model Performance
To assess how well our model performs, we use standard classification metrics: accuracy, precision, recall, and the confusion matrix.
print(f'Accuracy: {round(accuracy_score(y_test, y_pred), 4)}')
print(f'Confusion Matrix:\n{confusion_matrix(y_test, y_pred)}')
print(classification_report(y_test, y_pred))Accuracy: 0.8351
Confusion Matrix:
[[484 78]
[ 59 210]]
precision recall f1-score support
0 0.89 0.86 0.88 562
1 0.73 0.78 0.75 269
accuracy 0.84 831
macro avg 0.81 0.82 0.82 831
weighted avg 0.84 0.84 0.84 831
The results are impressive for a manually built model:
- Accuracy: 83.5% — the model correctly classified over 8 out of 10 patients.
- Precision & Recall: Both classes show solid performance, though slightly stronger for non-diabetic predictions.
- Confusion Matrix:
- 484 true negatives (correctly identified as non-diabetic)
- 210 true positives (correctly identified as diabetic)
- 78 false positives and 59 false negatives
These numbers show that our KNN model, built entirely with NumPy, is not only functional but also reliably predicts diabetes outcomes.
Conclusion
In this project, we implemented the K-Nearest Neighbors (KNN) algorithm completely from scratch using NumPy and applied it to a real-world diabetes prediction dataset.
By manually building every step, from computing Euclidean distances to performing majority voting, we gained an in-depth understanding of how KNN operates behind the scenes.
After proper preprocessing and scaling, our model achieved an accuracy of 83.5%, proving that even a simple, hand-coded implementation can produce strong results on structured healthcare data.
This project not only strengthens your foundation in machine learning fundamentals but also demonstrates to potential recruiters your ability to build, explain, and evaluate algorithms from the ground up, a skill that sets you apart as both a developer and a learner.